
As LLMs and AI chatbots continue to grow, many argue they shorten the customer journey and could challenge the role of traditional search engines. A popular belief is that visitors coming from LLMs are more qualified and convert at higher rates compared to organic search. While I’ve often leaned toward this perspective, I decided to dig into our own first-party data and run a deeper analysis to see if the results actually support it.
Comparing Conversion Rates: LLM Traffic vs. Organic Search
There are countless angles and metrics we could explore in this analysis, but I decided to focus on a single question that could deliver the clearest insight:
Is the conversion rate of LLM traffic higher than organic search?
If the data shows stronger conversion performance, it could reshape how we view the future role of LLMs in driving business outcomes. This study aims to ground the debate in evidence rather than speculation.
How We Measured It (and the Hurdles)
The research started with a wide mix of websites from different sectors, but only some were suitable for a fair study. To avoid misleading results, we applied strict rules and kept only the sites that could show clear business value through measurable actions.
Selection Criteria
Macro Conversions
- We included only websites that showed real business outcomes.
- For B2B companies, this meant demo requests or form fills.
- For e-commerce, this meant purchases.
- Websites that only measured clicks or time spent were left out, as they don’t show direct value.
Tracking Checks
- Conversion tracking needed to work correctly.
- We manually checked each site’s setup to make sure the data was reliable and accurate.
Final Dataset
Once the rules were applied, the pool was narrowed down to 54 websites that matched the requirements. For each site, data from the past six months was taken directly from GA4 to ensure consistency.
Conversion performance was measured on a per-session basis rather than per-user. This method allowed results to stay consistent across both B2B and e-commerce sites. Using session-level tracking also prevented the numbers from being distorted in cases where a single shopper might complete multiple purchases.
Challenges
Even after refining the dataset, some obstacles remained. Conversion events were not standardized across websites, which made it harder to compare results fairly. Since each site used different event names and tracking setups, a direct one-to-one comparison wasn’t possible.
To address this, every site was reviewed individually. Events were verified, matched, and mapped against equivalent business-focused conversions. While this manual process required significant time, it ensured the findings were based on accurate and consistent measures rather than incomplete or misleading data.
Statistical Approach
To make sure the findings were reliable and not just based on broad averages, a set of statistical approaches was used. The goal was to confirm whether the observed differences in conversion rates were steady and significant across the dataset.
Examined differences in conversion rates between organic traffic and LLM traffic at the site level
Looked at both averages and medians to handle uneven or skewed data distributions
Measured variability through indicators like standard deviation (SD) and interquartile range (IQR)
Applied paired t-tests to directly compare organic and LLM results within the same websites
Used Welch’s test to compare broader groups such as B2B versus B2C
Applying these checks created multiple layers of validation and built a solid foundation for the results discussed in the next section.
Results
Across the combined dataset, organic sessions showed a conversion rate of 4.60%, while visits referred from LLM platforms converted at 4.87%. On the surface, this points to a slight edge for LLM-driven traffic.
Yet relying only on averages can create a misleading picture. To test whether this gap held up consistently across individual sites, we looked at the mean difference in conversion rates (LLM – Organic), which landed at +0.27 percentage points (pp). The median gap was much smaller at just +0.09 pp. Variability was captured through a standard deviation of 7.53% and an interquartile range (IQR) of 1.78%. Finally, a paired t-test showed that the difference lacked statistical significance (p = 0.794).
Table 1. Conversion Performance: Organic Traffic vs. LLM Referrals
| Metric (Session-Based) | Organic Traffic | LLM Traffic | Difference (LLM – Organic) |
|---|---|---|---|
| Median Conversion Rate | 4.87% | 7.05% | +0.09 pp |
| Mean Conversion Rate | 4.60% | 4.87% | +0.27 pp |
| Interquartile Range (IQR) | N/A | N/A | 1.78% |
| Standard Deviation (SD) | N/A | N/A | 7.53% |
| Paired T-Test | N/A | N/A | p = 0.794 |
These findings indicate that LLM traffic does not convert at a rate meaningfully different from organic search. Both channels performed at nearly the same level, and while the overall averages showed a slight edge for LLM, the effect was not consistent enough across sites to be considered reliable. Taken broadly, this points to LLM referrals behaving much like organic traffic when it comes to conversion effectiveness.
On the statistical test
The paired t-test was used to compare conversion rates for organic and LLM traffic within each site, assessing whether the gap remained consistent across the dataset. With a p-value of 0.794, the difference observed is most likely due to random fluctuation or outliers rather than a systematic pattern. For perspective, statistical significance typically requires a p-value under 0.05. Put simply, the small uplift seen in averages disappears once site-level variability is factored in.
Does LLM Traffic Outperform Site Averages in a Consistent Way?
To understand whether LLM-driven visits tend to deliver stronger conversion performance compared to overall site traffic, we looked at differences at the individual site level. The scatterplot in Figure 1 illustrates this by plotting the proportion of sessions coming from LLMs (x-axis) against each site’s conversion rate ratio (y-axis).
Conversion Rate Ratio = LLM Conversion Rate ÷ Total Site Conversion Rate
How to interpret the scatterplot (y-axis ratio):
A value of 1 means LLM traffic converts at the same rate as the site’s overall average.
A value greater than 1 indicates LLM traffic is outperforming the site average.
A value below 1 shows that LLM traffic is converting less effectively than the site average.
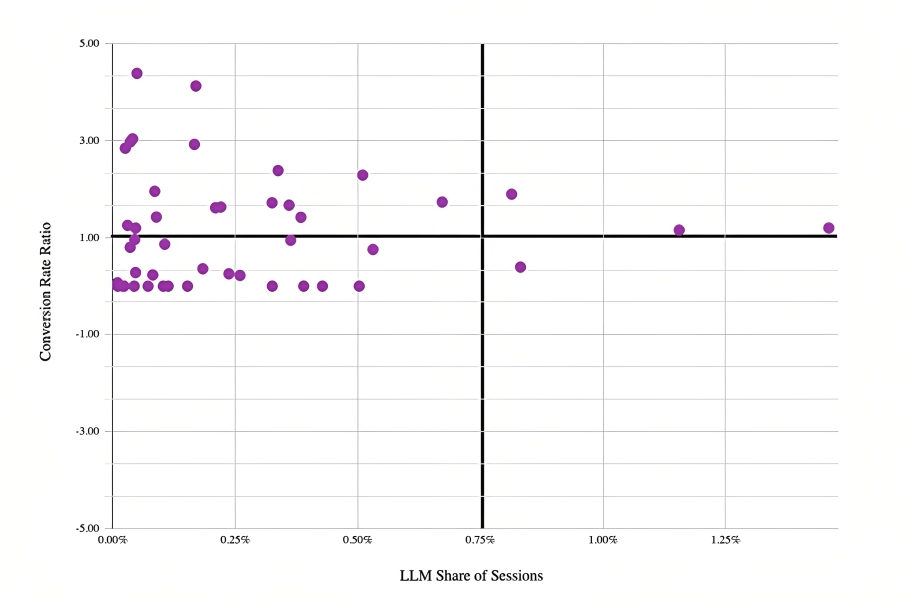
Figure 1. LLM Sessions vs Conversion Rate Ratio
The visual highlights a mixed outcome rather than a clear pattern. Points are spread across both sides of the reference line (y = 1.0), showing that LLM traffic sometimes performed better than the site average and sometimes lagged behind.
We then quantified the spread by calculating the number of sites in each outcome group.
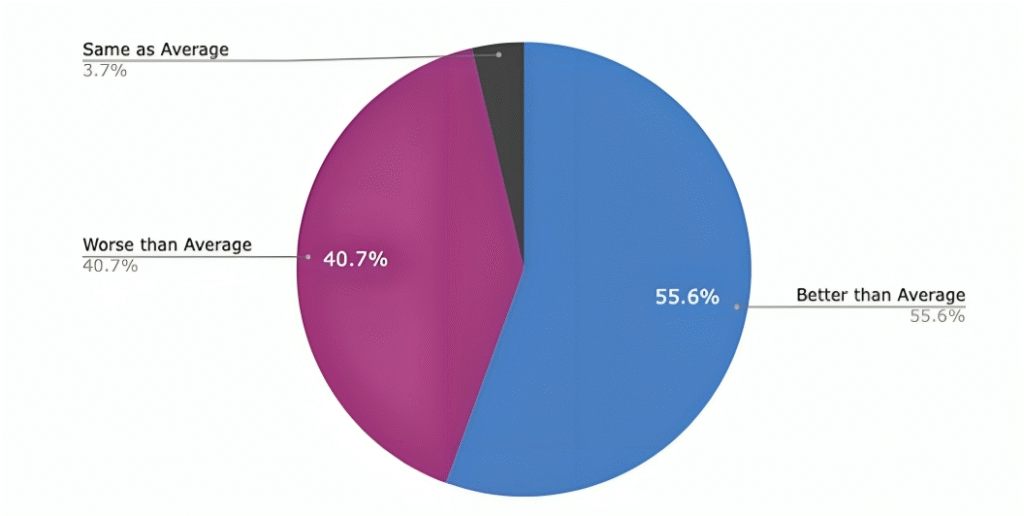
Figure 2. Figure 1. LLM Sessions vs Conversion Rate Ratio
When we looked deeper into site-level data, 56% of websites showed that LLM traffic converted at a higher rate than their site average, while 41% converted at a lower rate, and 4% stayed about the same. This almost even mix shows that LLM traffic doesn’t always perform better, results change from site to site without a clear pattern.
Sensitivity Check: What Happens on Larger Sites
To make sure smaller sites with very little LLM traffic didn’t affect the results, we set a few basic limits. This helped us focus on websites with enough data to give a fair comparison.
The limits used were:
- At least 100,000 total sessions
- At least 50 LLM sessions
- At least 5 LLM conversions
After applying these limits, the dataset went from 54 sites down to 33 sites. We used the same six-month period, but this smaller group gave a clearer picture of how LLM traffic behaves when there’s enough data to rely on.
Table 2: Sensitivity Analysis – All Records vs. Subset Records
| Metric | Full (54 Sites) | Thresholded (33 Sites) |
|---|---|---|
| Organic mean | 4.60% | 5.81% |
| LLM mean | 4.87% | 7.05% |
| Difference (LLM – Organic) | +0.27 pp | +1.24 pp |
| Median Difference | +0.09 pp | +0.46 pp |
| SD of Differences | 7.53% | 7.91% |
| IQR of Differences | 1.78% | 1.87% |
| Paired t-test (p-value) | 0.794 | 0.376 |
Although the average difference increased in the selected sample (+1.24 percentage points compared to +0.27 percentage points), the findings were not statistically significant (p = 0.376). This suggests that even when analyzing busy websites with more traffic and conversions, LLM traffic didn’t consistently perform better than organic traffic in terms of conversion rates.
Examining Business Models: Performance of LLM Traffic vs. Organic Traffic
We also broke down the data by business model to determine if B2B and B2C websites showed different results.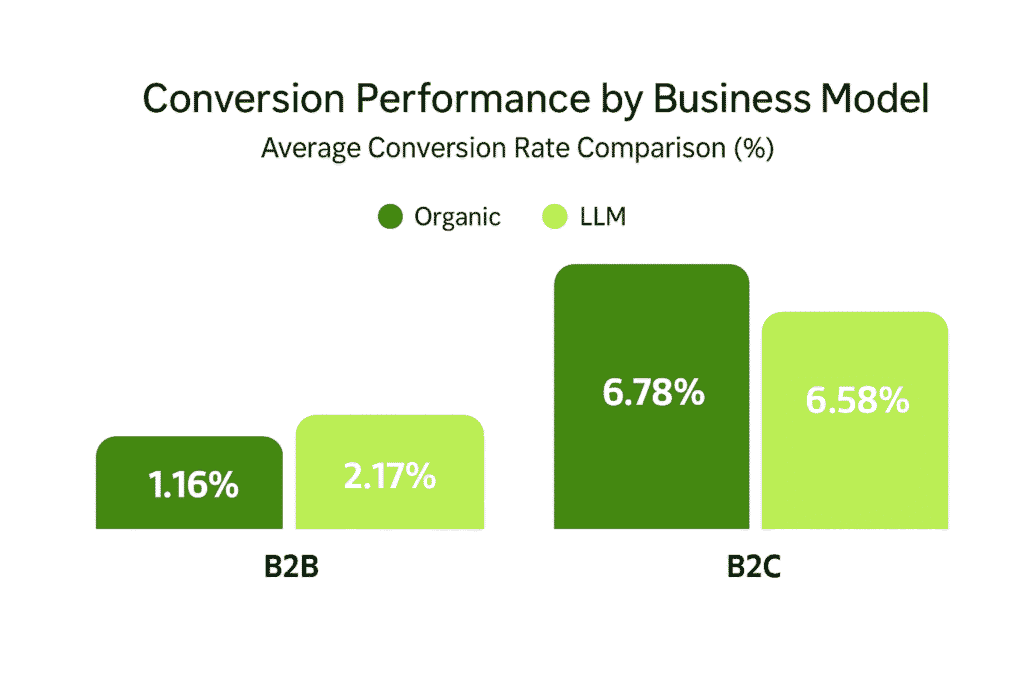
Figure 3. Conversion Rates by Business Model
In the complete dataset, LLM traffic had a slightly higher conversion rate for B2B websites (2.17% compared to 1.16% for organic). However, for B2C websites, LLM traffic converted slightly less (6.58% vs. 6.78%). On the surface, it seems that the two models are headed in different directions, but there was no clear pattern indicating LLM traffic had a noticeable edge.
To make sure our comparisons were valid, we used the same criteria as before (≥100,000 sessions, ≥50 LLM sessions, ≥5 LLM conversions), which narrowed down the sample to 33 sites, divided between B2B and B2C.
Table 3. Results Based on Thresholds by Business Model
| Metric | B2B | B2C |
|---|---|---|
| Organic mean | 1.68% | 8.50% |
| LLM mean | 2.03% | 10.31% |
| Difference (LLM – Organic) | +0.35% | +1.81% |
| Median Difference | 0.76% | 0.20% |
| Standard Deviation | 3.25% | 9.89% |
| Interquartile Range (IQR) | 1.58% | 2.88% |
| Paired T-Test (p-value) | 0.705 | 0.423 |
The results after applying the thresholds indicated that both B2B and B2C sites showed a slight positive trend for LLM traffic, yet neither difference reached statistical significance (p = 0.705 for B2B and p = 0.423 for B2C). We also conducted Welch’s test to see if the difference between B2B and B2C sites was significant. This test aimed to determine if LLM traffic had a greater effect on one model than the other. The outcome (p = 0.546) confirmed that no significant difference existed.
In summary, it seems that the business model does not significantly affect how LLM traffic converts compared to organic traffic. Both B2B and B2C sectors display small positive differences, but the variability among the sites is too great to establish a clear trend.
LLM Traffic: Why It Constitutes Less Than 1% of Total Site Traffic
Proportion of Sessions from LLM
To grasp the extent of LLM traffic in relation to overall site performance, we first assessed its share of total sessions across all sites. As illustrated in Figure 4, most sites had less than 1% of their sessions generated by LLM traffic, emphasizing the limited role this channel plays overall.
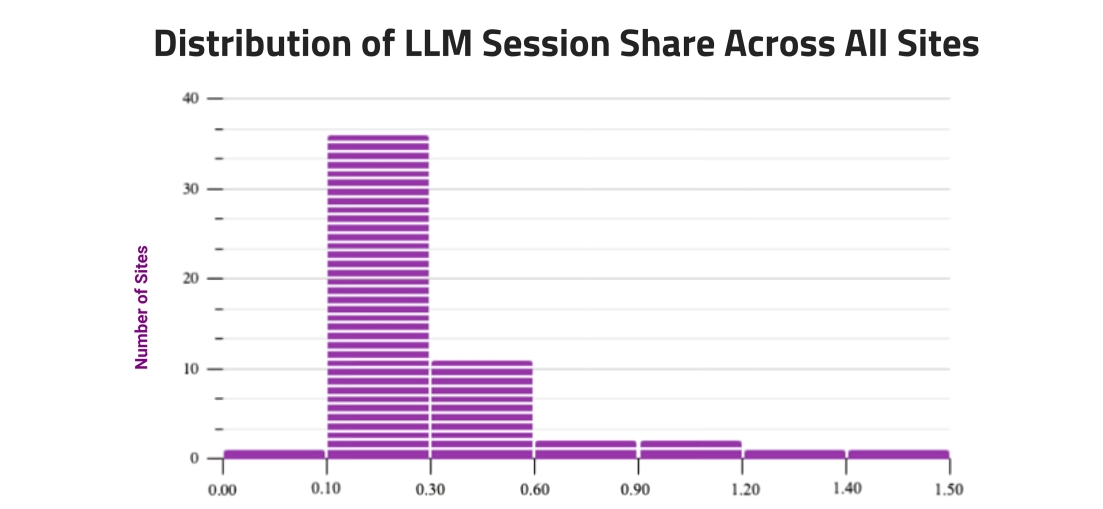
Figure 4. Share of Sessions from LLM Traffic
Although a few sites reported higher shares, the percentage distribution clearly illustrates that the contribution of LLM traffic is generally low:
- Almost 90% of sites had LLM traffic accounting for less than 0.6% of their total site traffic.
- Only around 10% of sites saw LLM traffic make up more than 0.6% of their total site traffic.
Average Contribution by Channel: Organic vs. LLM
To provide a direct comparison of contributions, we also analyzed the average share of sessions and conversions by channel across all sites. Figure 5 (below) clearly illustrates the significant differences.
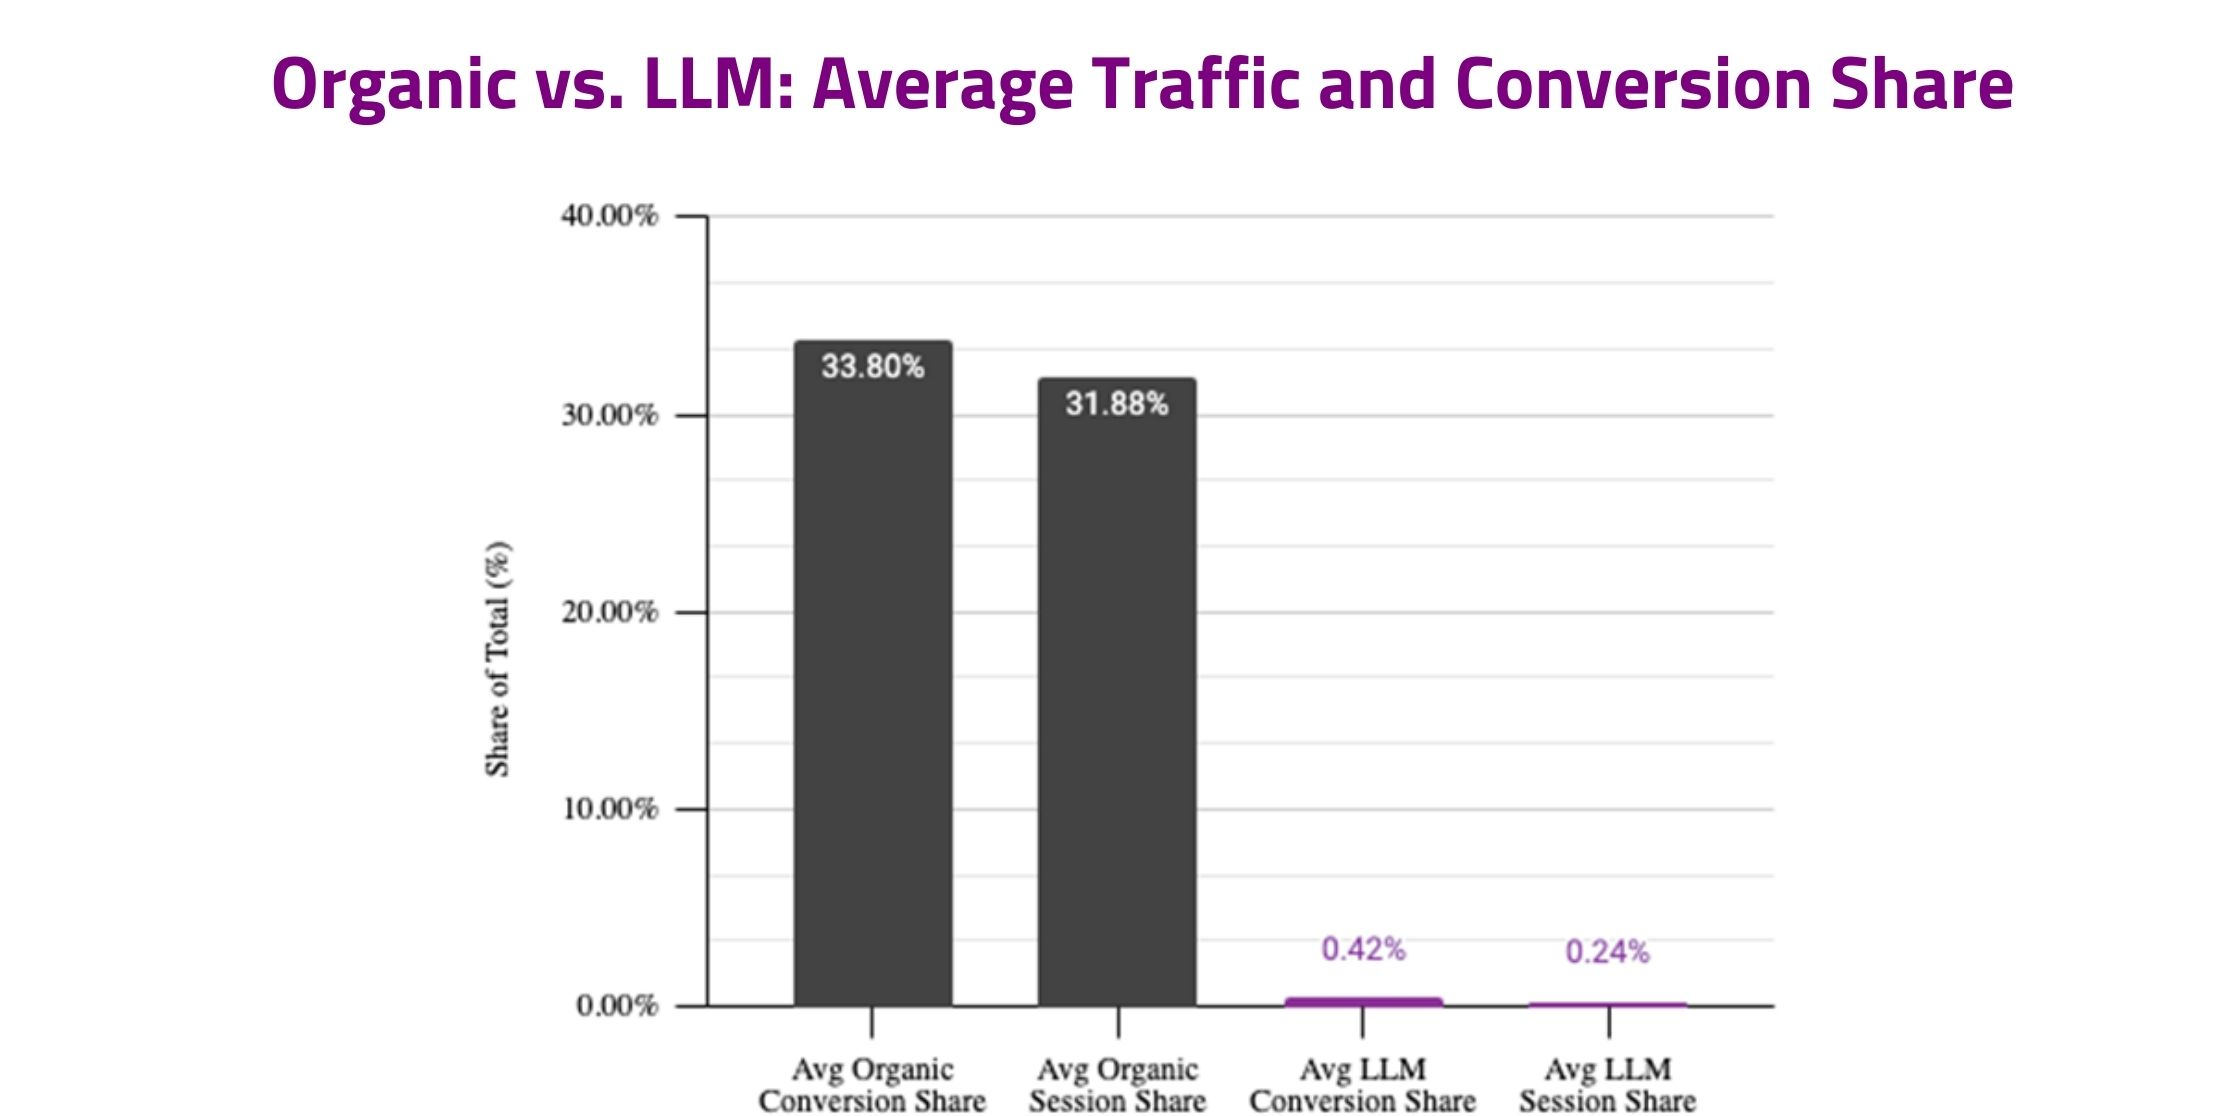
Figure 5. Comparison of Average Contributions: Organic versus LLM
Organic traffic comprised about one-third of total sessions (31.9%) and conversions (33.8%), while LLM traffic accounted for less than 1% on average (0.24% of sessions and 0.42% of conversions). Paired t-tests showed that these differences were statistically significant (p < 0.001). This indicates that, despite similar conversion efficiencies, the overall volume of LLM traffic is minimal in comparison to organic traffic.
Industry-Based Segmentation Analysis
We further analyzed the data by industry vertical to identify any overarching trends. Figure 6 illustrates that, although conversion rates differed significantly across industries, there was no clear advantage at the channel level.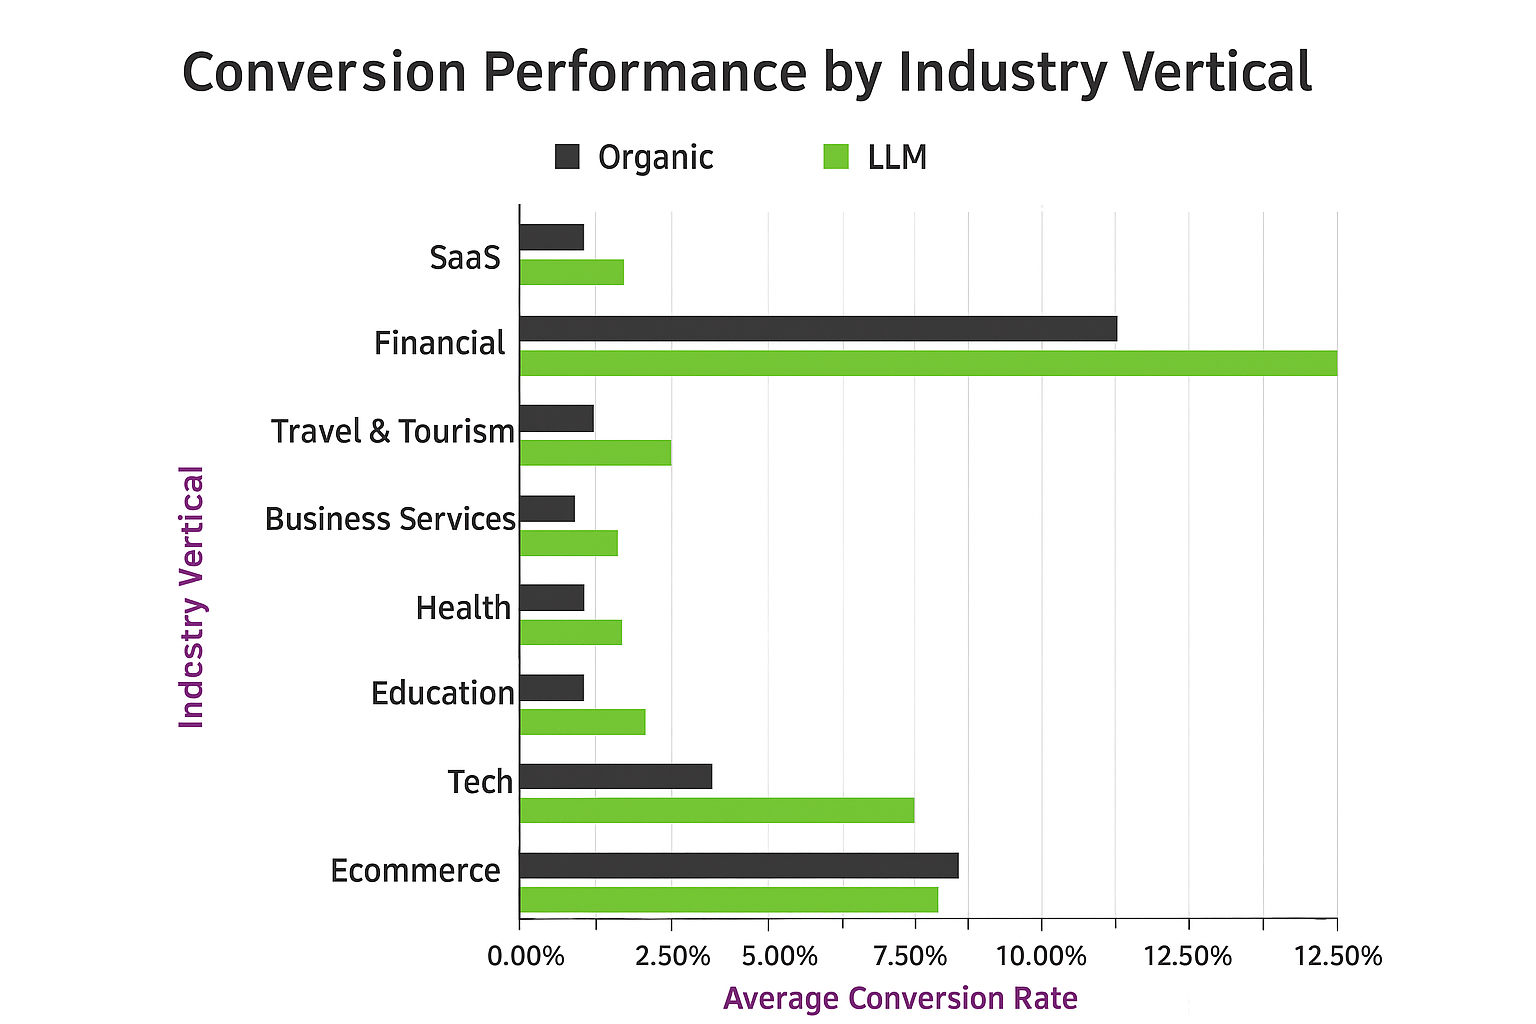
Figure 6. Industry Vertical Conversion Rates
In analyzing specific industries:
- LLM traffic showed higher conversion rates in sectors like Financial Services and Travel & Tourism.
- Conversely, organic traffic performed better in areas such as eCommerce and Consumer Services.
While these exploratory findings offer useful insights, it’s important to interpret them cautiously due to the limited sample sizes within each vertical.
Data Interpretation
The findings from this study reveal that LLM traffic is not providing a measurable conversion advantage over organic traffic at this time. The onus was on LLM traffic to prove that it converts at a rate higher than organic, and this dataset did not substantiate that.
While averages indicated a slight increase, statistical testing confirmed that the difference was not significant. This suggests that, within this dataset, LLM traffic converts similarly to organic traffic and overall site averages. The scatterplot and efficiency breakdown further clarified this point: some sites performed better with LLM traffic, while others performed worse, resulting in an essentially even split. This variability indicates a lack of consistent advantage.
Even when filtering out low-volume sites, the gap between LLM and organic traffic widened slightly, but not enough to be statistically relevant. Although there are instances where LLM traffic appears promising, the overall trend across sites lacks robustness for a confident conclusion.
The segmentation analysis echoed this pattern. Both B2B and B2C sectors showed a slight positive trend for LLM, but the variability was too high to be significant. Welch’s test indicated no measurable difference between the two groups, given their differing sizes. The industry splits were similarly varied, and small sample sizes hampered any strong interpretations.
The key takeaway is scale. Organic traffic consistently accounted for about one-third of total sessions and conversions across nearly all sites and industries. In contrast, LLM traffic remained below 1%. Even where efficiency seemed somewhat higher, the overall impact compared to organic traffic was minimal.
Limitations and Considerations in Comparing LLM and Organic Conversions
This analysis focuses on macro conversions, specifically form submissions for B2B sites and purchases for e-commerce sites. While purchases indicate actual customers, form submissions and demo requests may not always convert to paying clients. Therefore, this study does not address lead-to-customer conversion rates.
Additionally, it’s essential to recognize that conversions during the buyer’s journey are seldom linear. Users typically interact with multiple touchpoints before making a purchase. For this analysis, we used last-touch attribution to assess conversions.
To gain better insights into the quality of conversions, I recommend organizations incorporate self-reported attribution in their lead forms. For instance, including an open-ended question like “How did you hear about us?” can offer valuable context for assessing traffic quality and the impact of different channels.
Conclusion
In conclusion, the customer journey is becoming increasingly complex and continues to evolve. It’s crucial not to single out any one channel as the ultimate solution for attracting qualified traffic.
Recent studies indicate that users are actively engaging with both traditional search and LLMs throughout their buying journeys. A recent report by Invoca highlights some key insights:
- 46% of buyers exclusively use traditional search for complex purchasing decisions.
- 44% utilize both AI and traditional search, with a preference for traditional search.
- Only 2% primarily rely on AI tools.
Brands should not overlook the importance of optimizing for LLMs and AI search. On the contrary, this emerging channel is becoming a vital part of the search landscape and should be integrated strategically into a comprehensive search strategy aligned with business goals.
Organic search continues to lead in both traffic and conversion shares across various industries. This remains the most consistent and undeniable finding from the data. For the majority of sites studied, LLM traffic is still minimal; however, some sites do experience a more significant share of sessions and conversions from LLMs. In these cases, focusing on LLM optimization becomes an essential strategy.
Businesses should start tracking and monitoring LLM traffic on a monthly basis, paying attention to:
- Growth trends over time (e.g., shifts in traffic share over the past year).
- The types of pages being highlighted by LLMs.
- How conversion performance stacks up against organic search.
For sites seeing only marginal traffic from LLMs, a balanced approach, recognizing the value of being an early adopter while still prioritizing proven channels, will be key to long-term success as the LLM ecosystem develops.
If you’re interested in understanding how LLM and AI-driven traffic impacts your business performance or want to optimize your website for AI-based search visibility, our team at Xzio can help.
Get in touch with our SEO experts to discuss a data-driven strategy that fits your business goals.